


 Services


Introduction
SaaS engineering teams that adopt autonomous quality assurance models measurably accelerate release cadence and cut defect costs, but only when they enter the CFO conversation armed with the right numbers. Most CTOs frame this as a tooling upgrade; finance teams hear cost center expansion and push back. The gap between engineering conviction and budget approval traces to one missing artifact: a structured ROI model tied to metrics finance already tracks. This playbook gives CTOs, VPs of Engineering and SaaS founders the pricing model guidance, specific ROI metrics and 90-day KPI framework needed to close that gap.
Agentic QA ROI is the measurable financial return a SaaS team captures by replacing manual quality assurance cycles with autonomous, AI-driven testing pipelines. It matters because the return compounds across every release: fewer production defects, shorter cycle times and higher release frequency each carry a dollar value finance can verify against existing reporting lines.
Before your first CFO meeting on this topic, map your current QA cycle time, defect escape rate and cost-per-defect to dollar values. Those three numbers are the foundation of every business case in this playbook. tkxel's AI Agents, Workflows & Agentic OS service is structured to support agentic QA engagements scoped to your team's stage and delivery cadence.
Key Takeaways
- Before your next CFO meeting, calculate cost-per-defect in production by dividing total engineering hours spent on bug fixes by the number of production defects, then multiplying by your fully-loaded engineer hourly rate. This converts a tooling argument into a P&L line.
- Choose an outcome-based or usage-based pricing model if your team is pre-Series B. Both structures tie vendor incentives to your release goals and reduce upfront financial risk.
- Capture four baseline metrics in Week 1 of any agentic QA engagement: QA cycle time, defect escape rate, release frequency and cost-per-defect. Without a clean baseline, your 90-day report has no comparison point.
- Present release cadence improvement alongside cost reduction when briefing leadership. Finance approves budget on cost; engineering and product leadership approve scope expansion on velocity.
- If a vendor cannot provide a week-by-week engagement structure with named delivery milestones, treat that as a commercial risk signal before signing.
What CFOs Actually Need to See
Finance leaders approve agentic QA budgets when three conditions are met: the spend maps to a known cost line, the ROI timeline is under 12 months and the metric used to measure success already exists in a dashboard they trust.
The cost line is concrete. QA labor, bug-fix rework and delayed release cycles all carry a measurable dollar value. As explored in tkxel's Software Quality Debt in AI Development, defects discovered late in the delivery process can increase engineering rework, production incidents and release costs. Quantify those costs before the CFO meeting, not during it.
The ROI timeline is where most internal pitches stall. According to Accenture's product reinvention analysis, adopting autonomous workflows and shifting from quarterly to bi-weekly release cycles can bring products to market up to 83% faster. Translated for finance: compressing a quarterly release cycle to bi-weekly means more than six times as many releases per year, each one a potential upsell, retention event or competitive response.
The existing-metric question is the most practical unlock. Release frequency, defect escape rate and QA cycle time are already tracked by most SaaS engineering teams. Anchor your business case to those three numbers and your CFO does not need to trust a new measurement system. They need to see the before-and-after delta.
How to Choose the Right Agentic QA Pricing Model
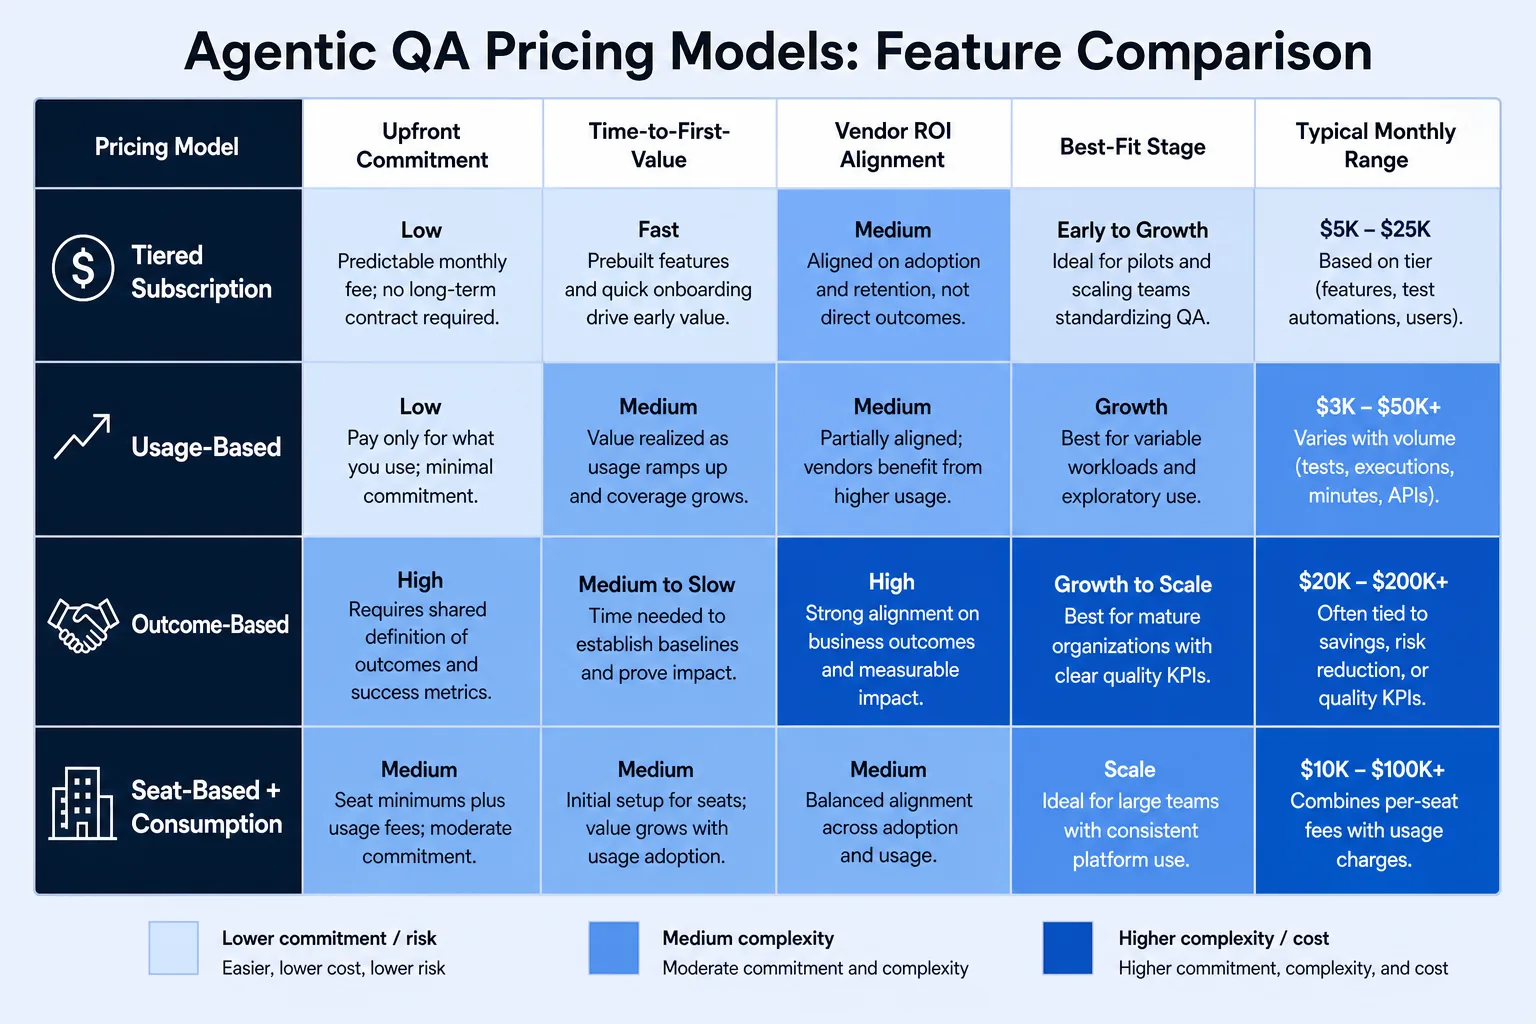
Agentic QA pricing models fall into four categories. Each carries a different risk-reward profile depending on team stage, release volume and finance team risk tolerance.
The table below compares four common agentic QA pricing structures, highlighting their commercial considerations and potential suitability for SaaS teams. Actual costs, implementation timelines and contract terms vary by vendor, testing scope and delivery requirements.
| Pricing Model | Upfront Commitment | Cost Structure | Vendor ROI Alignment | Potential Best Fit |
|---|---|---|---|---|
| Tiered Subscription | Fixed recurring commitment | Predictable subscription fees | Limited direct outcome linkage | Teams with stable testing volumes |
| Usage-Based | Variable commitment | Charges based on consumption | Linked to usage rather than results | Teams with fluctuating testing demand |
| Outcome-Based | Contract-dependent | Payments tied to agreed outcomes | Directly linked to defined results | Teams prioritizing measurable performance improvements |
| Seat-Based + Consumption | Fixed seats with variable charges | Per-seat fees and additional usage costs | Limited direct outcome linkage | Larger teams with predictable user counts |
Tiered subscription pricing suits scaling teams with predictable sprint cadences. Finance teams prefer it because the monthly line item is fixed. The trade-off: you pay whether utilization is high or low, and vendors have limited incentive to maximize defect detection once the contract is signed.
Usage-based pricing ties spend directly to test execution volume. According to Mordor Intelligence, the services segment of the AI-powered software testing and QA market is projected to grow at a 27.28% CAGR through 2031. Vendor pricing may evolve as the market expands. Usage-based models give you flexibility to scale spend as release frequency increases, without renegotiating a fixed contract. The downside is that cost forecasting requires tighter sprint-level volume estimates.
Outcome-based pricing is the most compelling structure for a CFO pitch because vendor compensation is tied directly to defect reduction or cycle time improvement. It aligns vendor incentives with your shipping goals. Both parties must agree on baseline metrics before the engagement starts, making the scoping conversation more rigorous but the approval conversation far shorter.
Seat-based with consumption overlay is common in enterprise QA platforms but poorly suited to early-stage SaaS teams. Fixed seat costs accumulate regardless of output, and the consumption overlay creates budget unpredictability at scale.
For a pre-Series B SaaS team, outcome-based or usage-based models reduce financial risk while keeping vendor incentives pointed at your release cadence. For a Series A–B team with defined sprint structures, a tiered subscription with a clear service-level agreement on defect escape rate gives finance the predictability needed to approve multi-quarter budgets.
The ROI Metrics That Win Internal Approval
Three metrics convert engineering conviction into financial approval. Each maps directly to a line on your finance team's P&L or engineering dashboard.
Cost-per-defect in production is the single most persuasive number in a CFO presentation. Calculate it by dividing total engineering hours spent on production bug fixes by the number of production defects in a quarter, then multiply by your fully-loaded engineer hourly rate. 37% of executives report ROI from AI agents in software development, compared to a 27% average across all use cases. Googlecloudpresscorner Software teams rank among the clearest beneficiaries of agentic investment precisely because defect costs are so directly traceable.
QA cycle time measures the interval from code commit to test completion. Reducing it can help eliminate testing delays that hold back product releases. According to AWS, First Orion reported a 20–25% reduction in QA cycles for specific testing scenarios after adopting agentic automation. For finance, the commercial value lies in whether faster validation enables earlier delivery of revenue-generating features.
Release frequency connects engineering performance to business outcomes in language leadership already speaks. Increasing release frequency from monthly to bi-weekly (about 2×) means product improvements reach customers faster and competitive responses can be delivered sooner. However, as discussed in tkxel's Software Quality vs Delivery Speed, faster releases must be supported by effective quality controls to avoid additional rework. Frame the current release frequency, the target and the dollar value of the gap. That structure turns a tooling conversation into a revenue conversation.
For help building a business case tailored to your finance team's existing reporting structure, tkxel's Advisory & Strategy practice can model the 12-month financial impact across all three metrics.
The 90-Day KPI Tracking Framework
No 90-day framework delivers value if the baseline measurement is missing. Instrument your CI/CD pipeline to capture four numbers in Week 1: QA cycle time in hours, defect escape rate as a percentage of total defects found post-release, release frequency per month and cost-per-defect. These four numbers are your contract with finance.
The framework runs in three phases of 30 days each.
-
Days 1–30: Establish baseline and configure agentic pipelines. Capture the four baseline metrics across two full sprint cycles. Pull actuals from your issue tracker and deployment logs; historical estimates introduce variance that undermines the 90-day comparison. Define the threshold that constitutes a successful outcome for each metric so both engineering and finance agree before results arrive.
-
Days 31–60: First automation runs and cycle time delta measurement. By end of Day 60, your agentic QA pipeline should run on every pull request. Measure QA cycle time against the baseline. A 20–35% reduction in this window is a realistic early signal. Document every defect caught by the agentic system that would have required a manual test cycle. That documentation is evidence, not anecdote.
-
Days 61–90: Full pipeline integration and ROI calculation. Calculate cost-per-defect reduction using the same methodology as the baseline. Report release frequency change and project the annualized value if the trend holds. Present results in a single-page summary: baseline, Day 90 actuals and projected 12-month impact. That summary becomes your budget renewal artifact.
About tkxel
tkxel is a B2B software engineering and AI services company helping SaaS teams accelerate release cycles, improve software quality, and reduce engineering costs. Its quality engineering capabilities span AI-driven testing, test automation, defect triage, and CI/CD integration. In its engagement with Signal, tkxel used Claude Code across development, QA, and DevOps, cutting regression testing cycles in half while maintaining human review throughout the delivery process. Read the case study.
Book a scoping call with tkxel to build your agentic QA business case with week-by-week milestones and a pricing structure your finance team can approve in a single review cycle.
Conclusion
The internal approval process for agentic QA investment is a sales problem, not an engineering problem. Finance teams approve spend when they see a defined cost line, a sub-12-month ROI timeline and metrics that already exist in their reporting stack.
The right pricing model determines how quickly that case closes. Outcome-based and usage-based structures reduce upfront risk and align vendor incentives with your release goals, making them the fastest path to CFO approval for pre-Series B teams. Tiered subscriptions work for Series A–B teams with stable cadences and a finance team that prioritizes line-item predictability.
If you have not yet mapped your QA cycle time, defect escape rate and cost-per-defect to dollar values, that is the first action to take before any vendor conversation. Those three numbers determine which pricing model your finance team will accept and how quickly you reach a signed engagement.
Book a scoping call with tkxel to build your agentic QA business case with week-by-week milestones and a pricing structure your finance team can approve in a single review cycle.


